Transform Data into Meaningful Insights.
Enhance laboratory efficiency with precision and compliance.
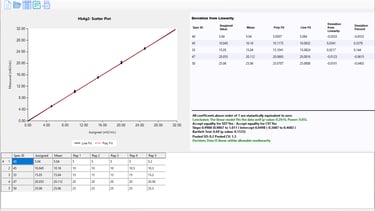
EP6 Linearity (CLSI EP06)
Description: Evaluates the correlation and bias between a test method and a comparative method using patient samples spanning the analytical measuring range.
Use: Proving that a new chemistry analyzer gives clinically equivalent results to your old one, or ensuring that a backup analyzer matches the primary analyzer so patient care isn't impacted by equipment downtime.
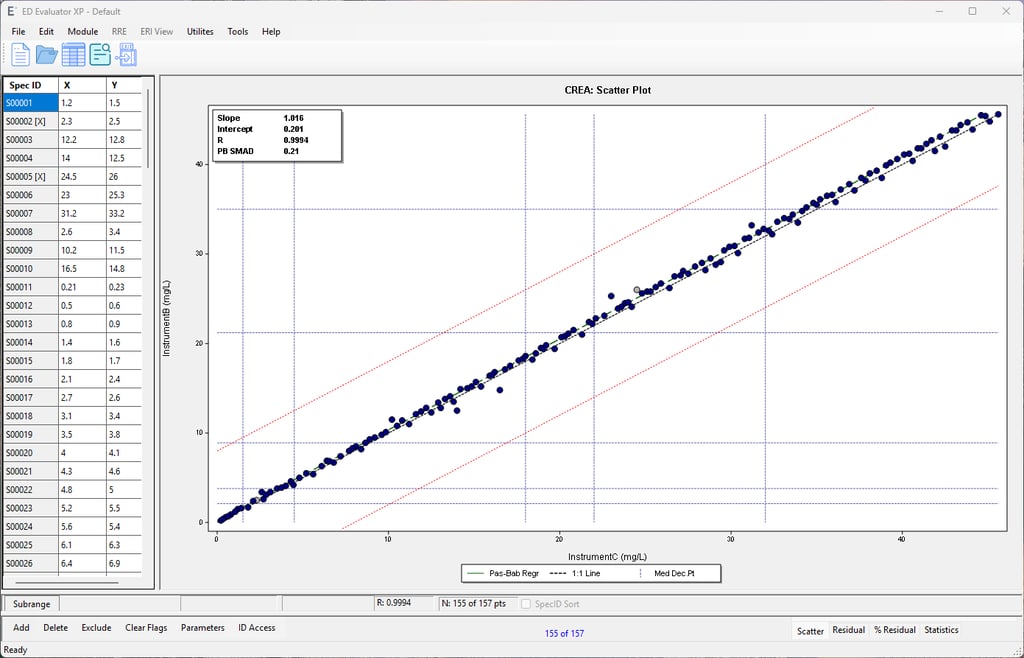
Two Instrument Comparison (CLSI EP09)
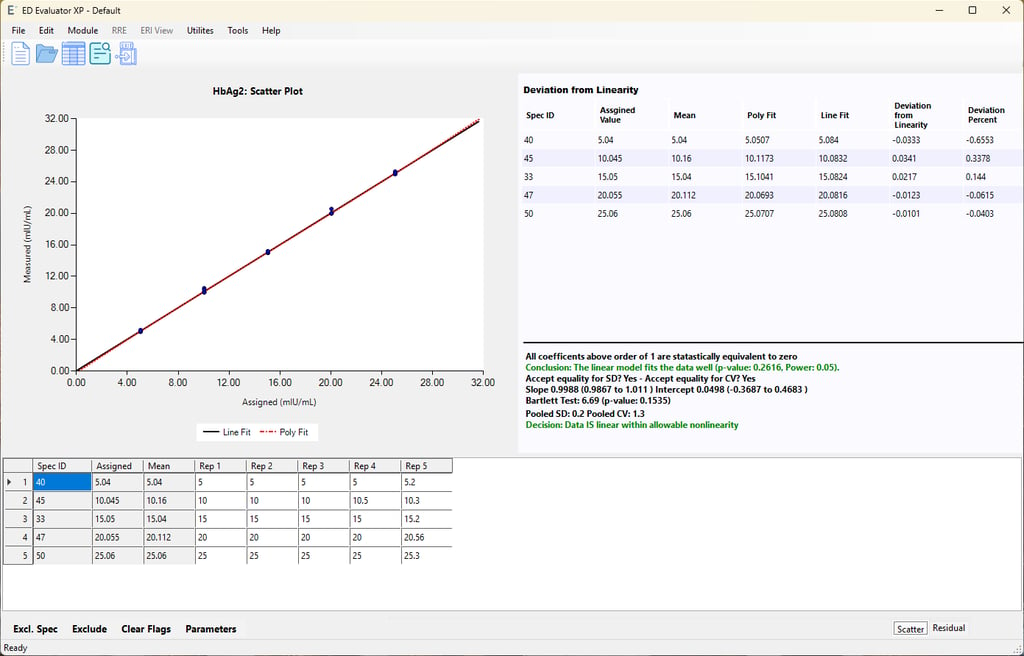
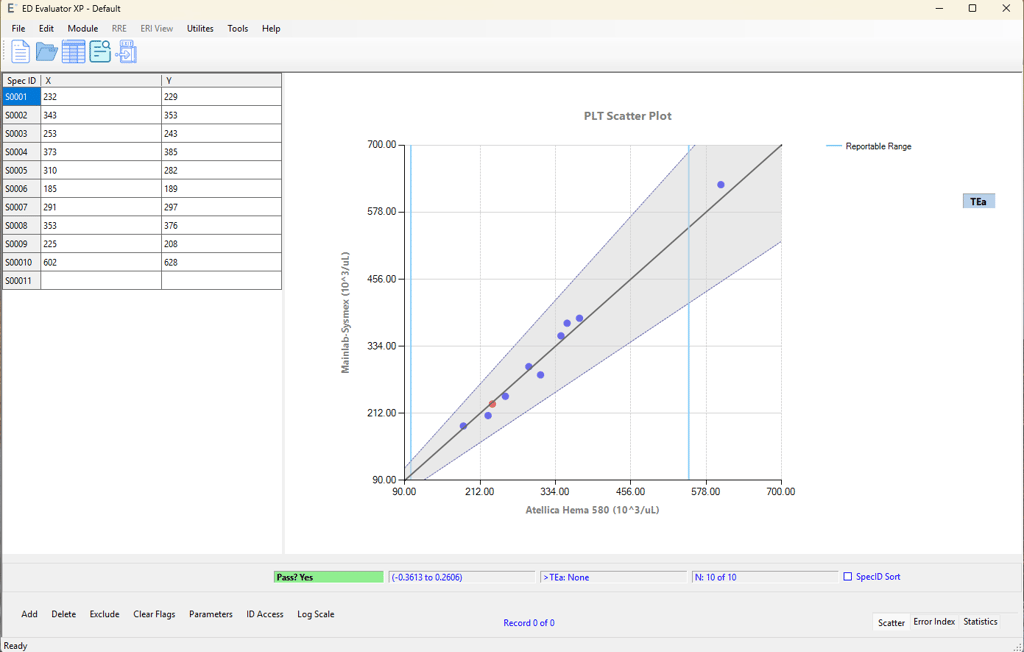
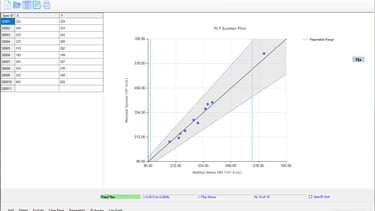
Description: Uses complex polynomial regression statistics to determine if a method's results are directly proportional to the analyte concentration. It specifically tests for non-linear "curves" in the data.
Use: Validating the Analytical Measuring Range (AMR) of an assay during an initial instrument installation to ensure both extremely high and low patient results are reported accurately without undetected systematic bias.
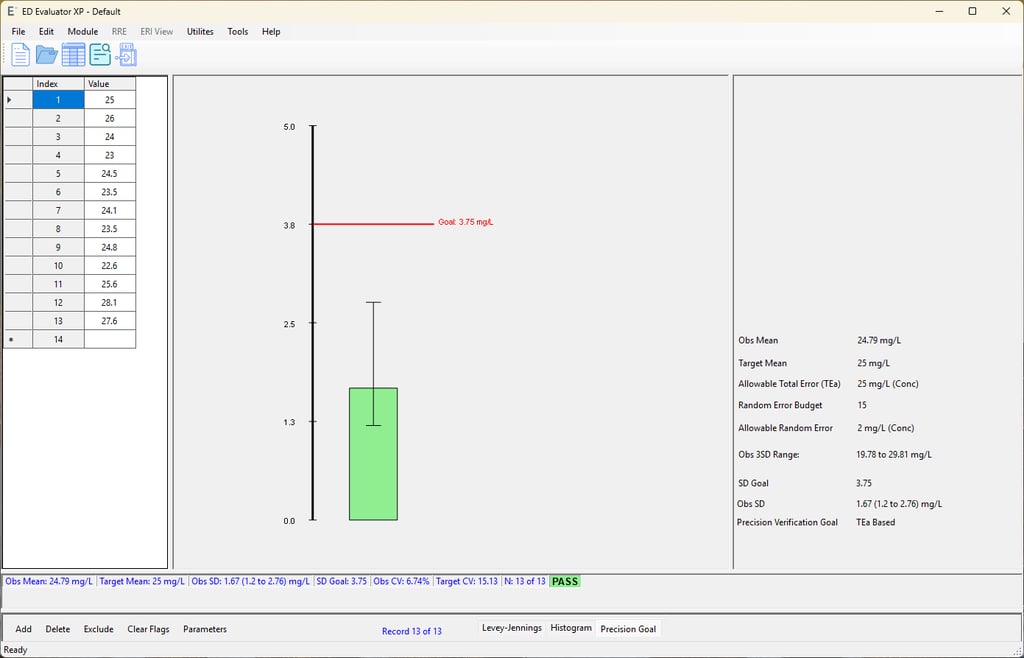
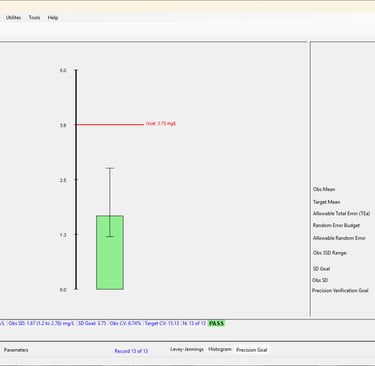
Simple Precision
Description: A basic statistical evaluation of repeatability (within-run precision). It usually involves running a single sample (like a quality control material) 20 times in a row.
Use: A rapid check of an instrument's baseline stability. It's often used immediately after major instrument maintenance, post-troubleshooting, or as a quick sanity check before committing to longer, more expensive precision studies.
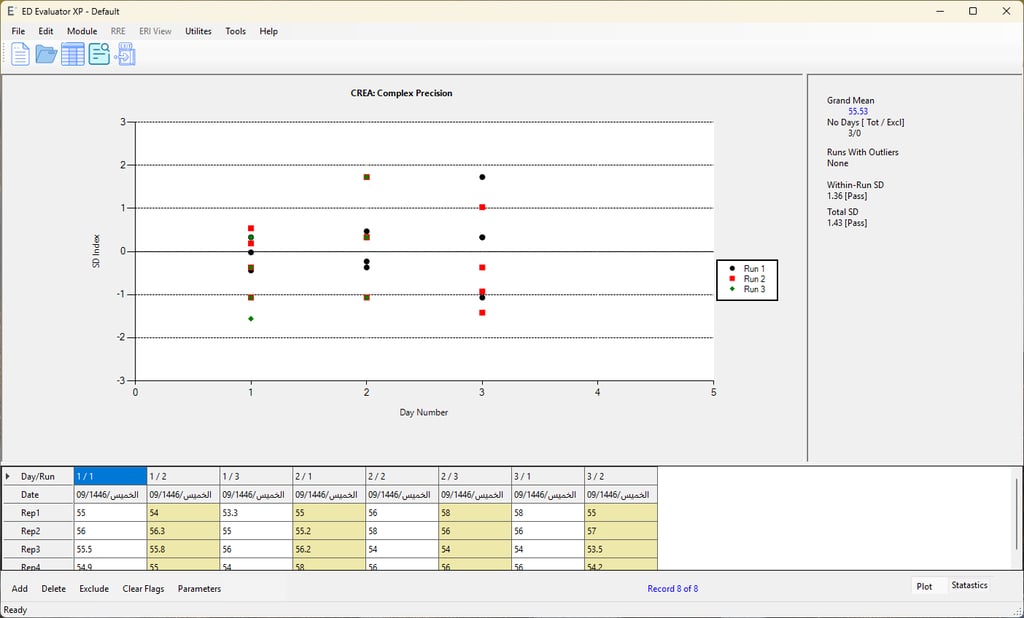
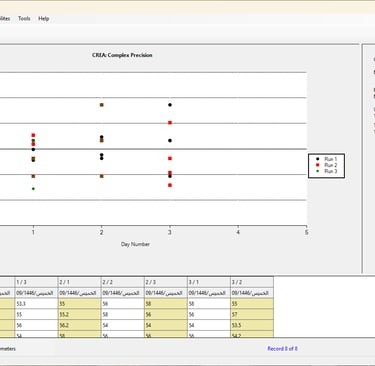
Complex Precision (CLSI EP05)
Description: A comprehensive study that calculates multiple sources of variation: within-run, between-run, and between-day. The classic CLSI design requires testing 2 levels of control material, 2 times a day, for 20 days.
Use: Fully validating the long-term total precision of an assay to ensure routine daily shifts (like different operators, minor temperature changes, or daily calibrations) don't introduce unacceptable error into patient results.
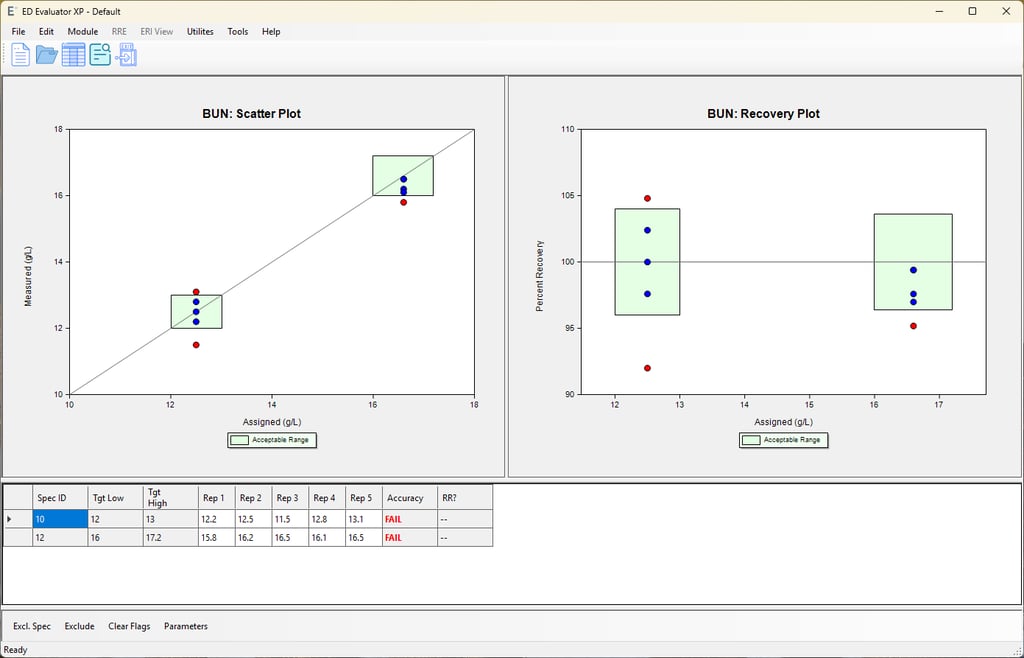
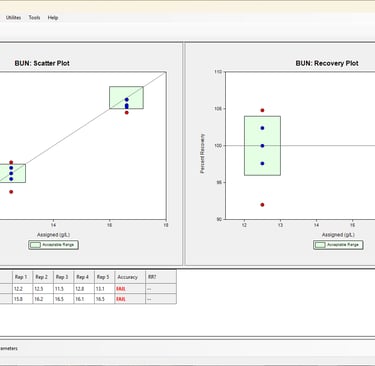
Simple Accuracy
Description: Compares test results of samples with known, fixed concentrations (such as commercial calibrators or proficiency testing/EQA materials) against their assigned target values.
Use: Verifying that your assay correctly recovers the "true" value of an analyte, which is particularly useful when you do not have a comparative instrument available to run a Two Instrument Comparison.
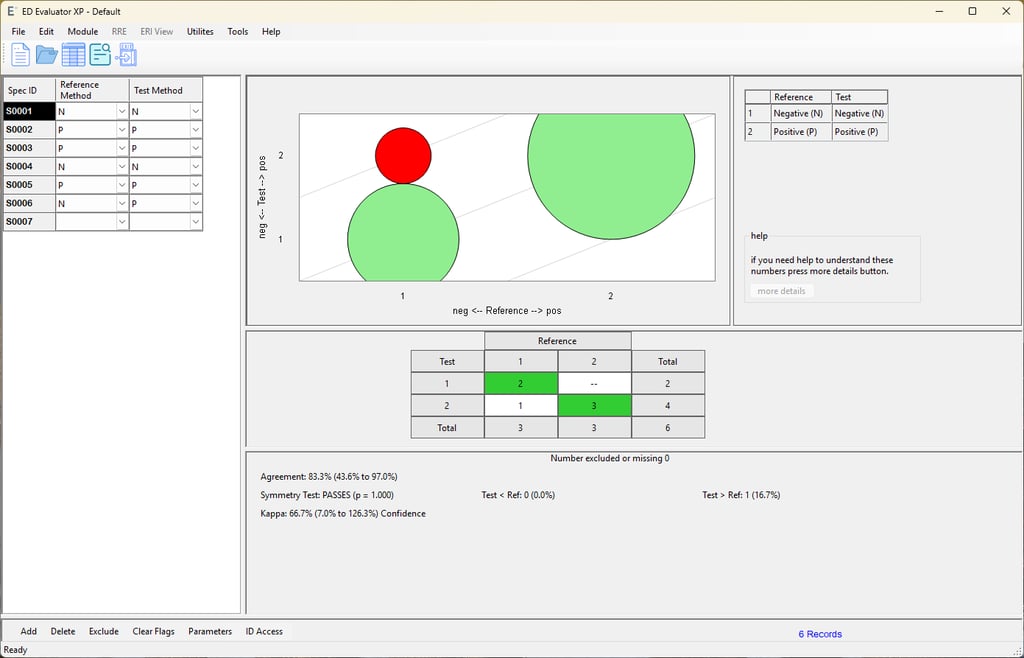
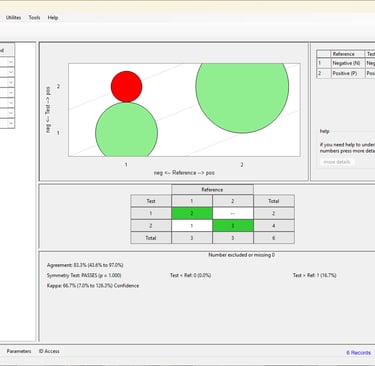
Qualitative Method Comparison (CLSI EP12)
Description: Evaluates the agreement between two non-numeric tests (yielding Positive, Negative, or Equivocal results). It calculates diagnostic sensitivity, specificity, positive/negative predictive values, and overall agreement.
Use: Validating rapid diagnostic point-of-care (POC) tests (e.g., COVID-19 Ag, Strep A, or urine pregnancy tests) against the central laboratory's gold standard method.
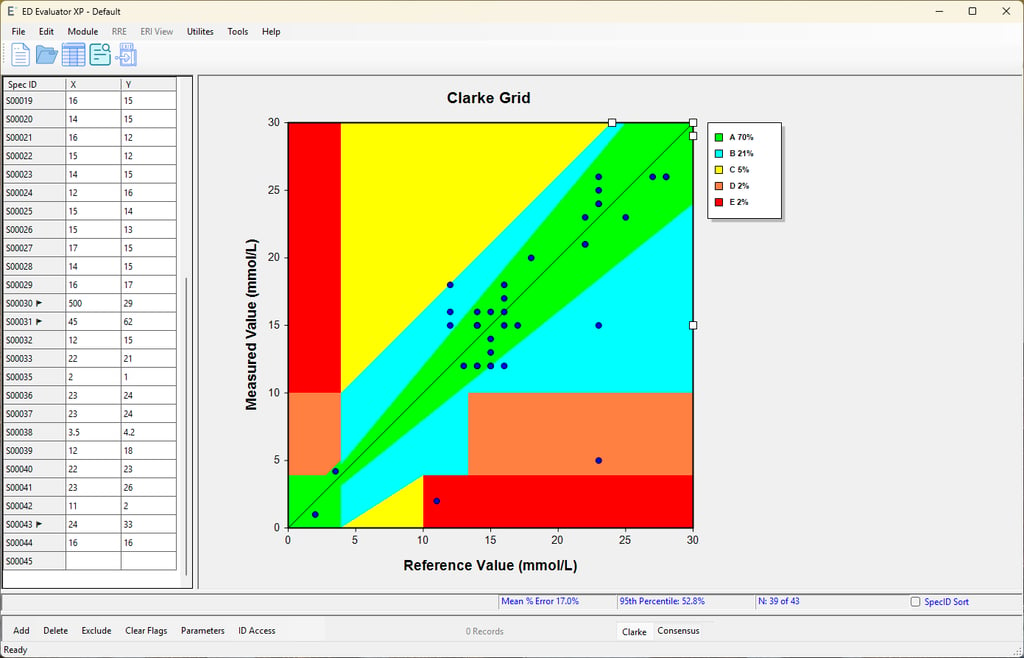
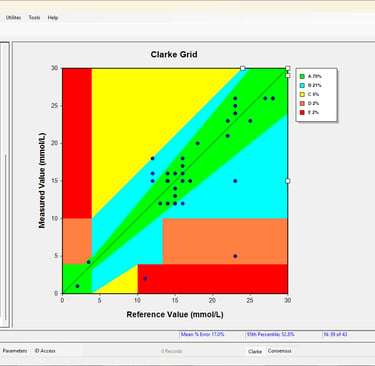
Glucose POC Instrument Evaluation
Description: A tailored statistical module designed specifically for Point-of-Care glucose meters. It evaluates accuracy using standardized error tolerance grids (like the Clarke Error Grid or ISO 15197 criteria).
Use: Rolling out new glucose meters to hospital nursing floors. It proves that a capillary fingerstick read by a nurse at the bedside is clinically concordant with a venous plasma sample run on the central lab's main chemistry analyzer.
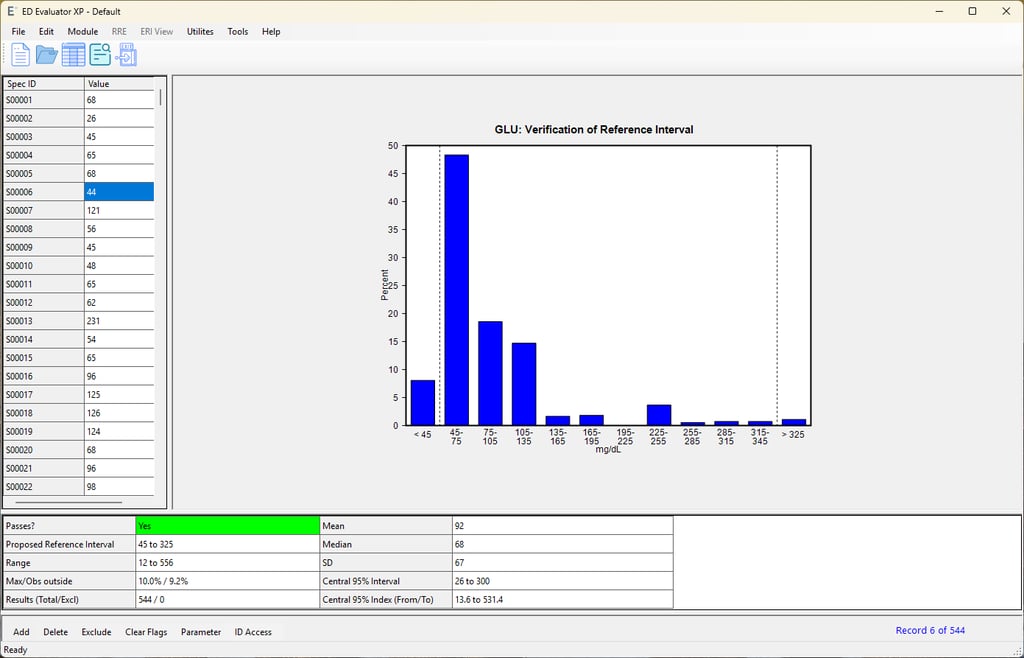
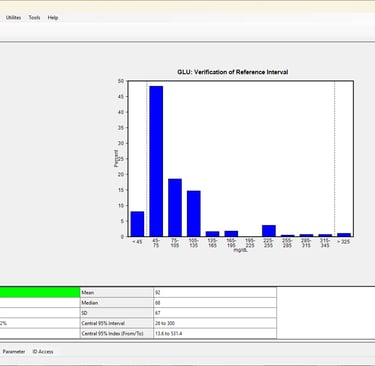
Verification of Reference Interval (CLSI EP28)
Description: Also known as "transference." Instead of testing 120+ healthy individuals to establish a new normal range from scratch, this experiment tests a small local cohort (usually 20 healthy subjects) to verify an existing manufacturer or literature range.
Use: Ensuring that the manufacturer's suggested "normal range" is statistically appropriate for the specific demographic and geographic patient population served by your laboratory.
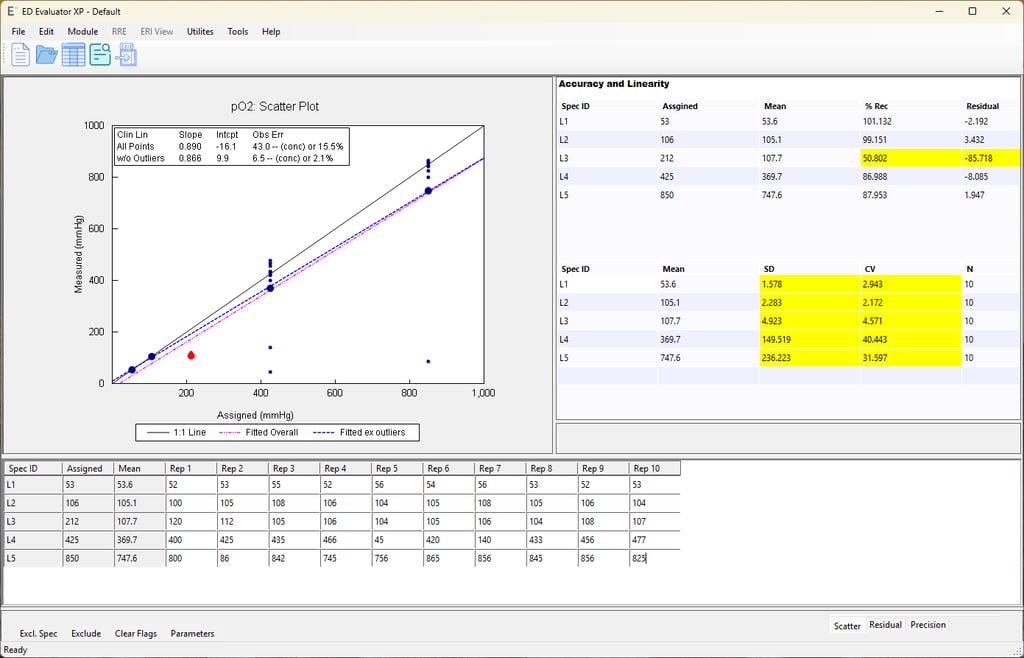
Linearity
Description: Similar to EP6, but often utilizes simpler, traditional statistical criteria (comparing results to predefined Allowable Error limits) to verify the assay responds linearly to varying concentrations.
Use: Fulfilling the CAP/CLIA requirement for routine, periodic calibration verification (typically every 6 months) to prove the AMR is still holding steady.
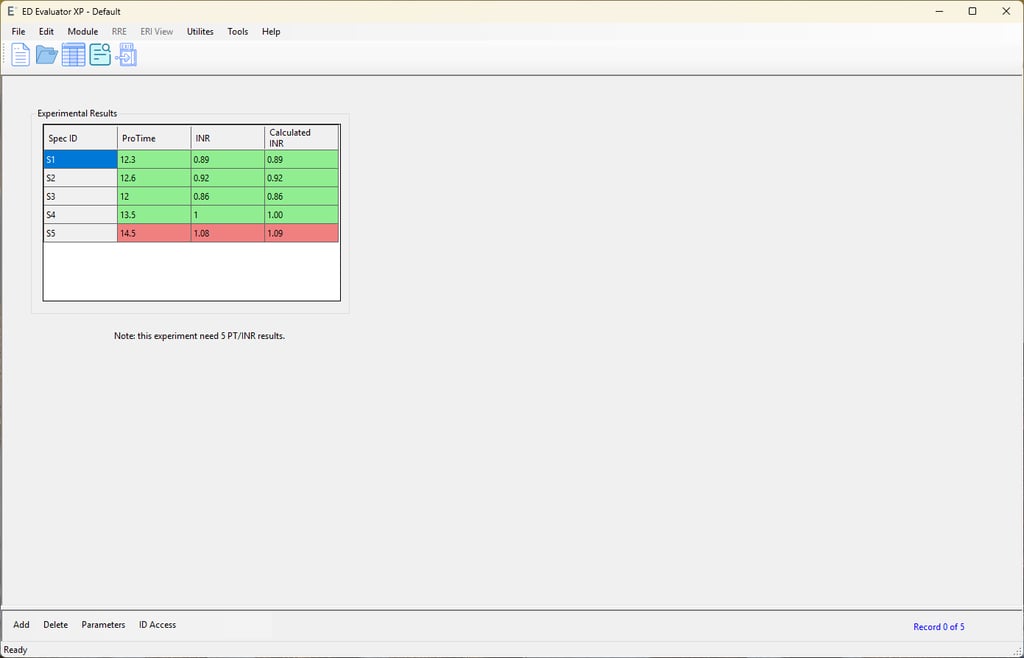
Manual INR Check
Description: A software/calculator check that verifies the mathematical conversion of Prothrombin Time (PT) seconds into an International Normalized Ratio (INR).
Use: Fulfilling regulatory requirements to periodically verify that your Laboratory Information System (LIS) or analyzer software is performing calculations correctly, ensuring patients on anticoagulants receive the right dosing guidance.
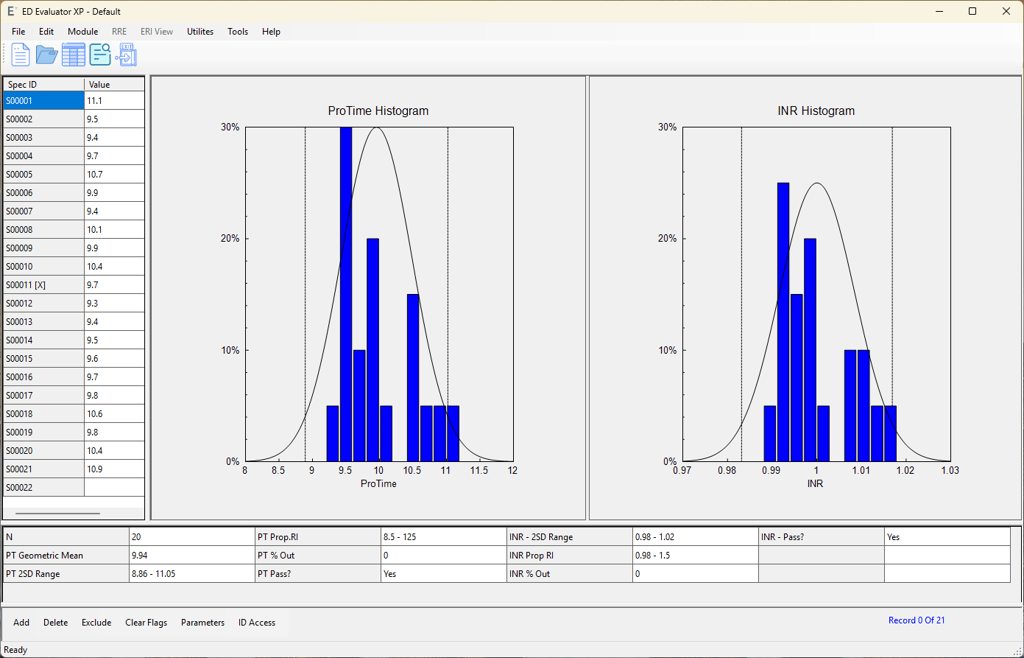
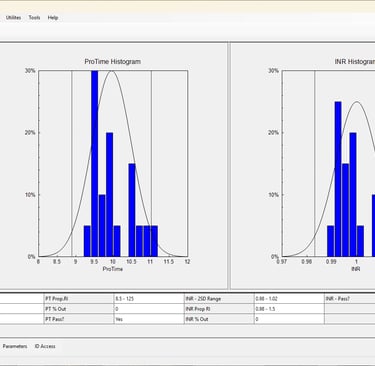
INR Module - Geometric Mean and VRI
Description: Calculates the Mean Normal Prothrombin Time (MNPT) using the geometric mean of healthy donors, and concurrently verifies the normal reference interval for INR.
Use: A mandatory step in the coagulation lab whenever you change to a new lot number of PT reagent. The MNPT must be recalculated because it is the denominator in the global INR equation: `INR = (Patient PT / MNPT)^ISI`.
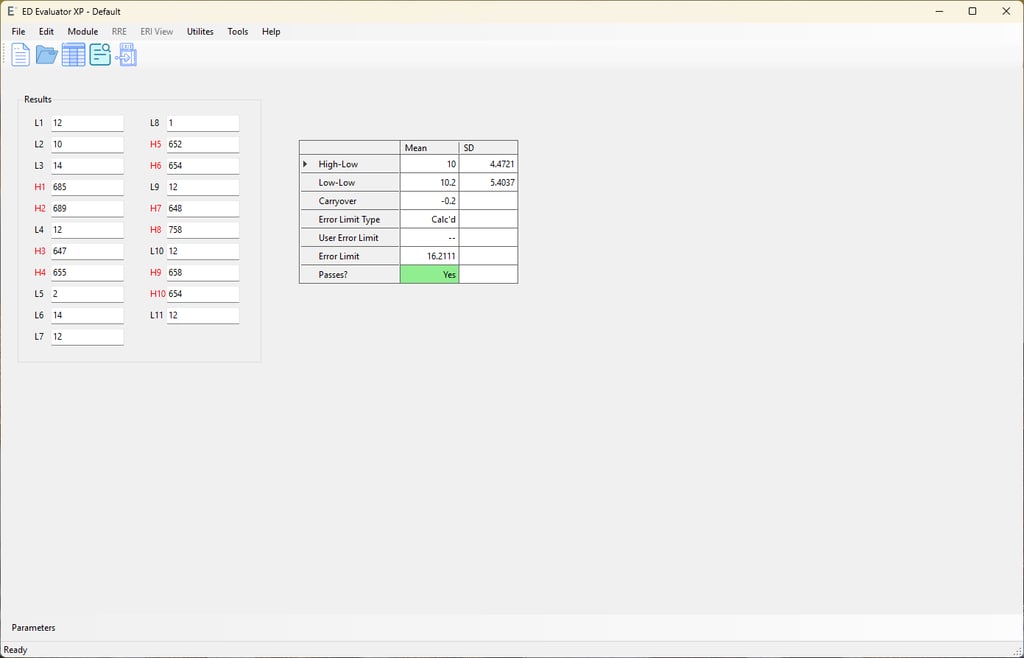
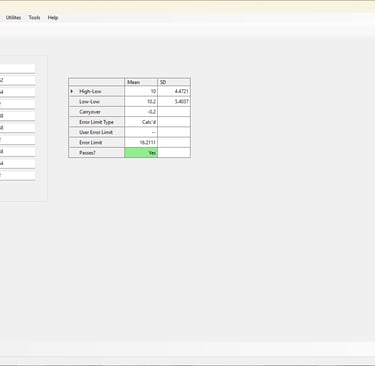
Carryover
Description: Evaluates whether a sample containing an extremely high concentration of an analyte falsely elevates the result of an immediately following sample that has a very low concentration.
Use: Proving that the analyzer's internal washing and pipetting mechanisms are effective. This is critical for analytes that have massive biological variance, such as beta-hCG (pregnancy), ferritin, or infectious disease viral loads.
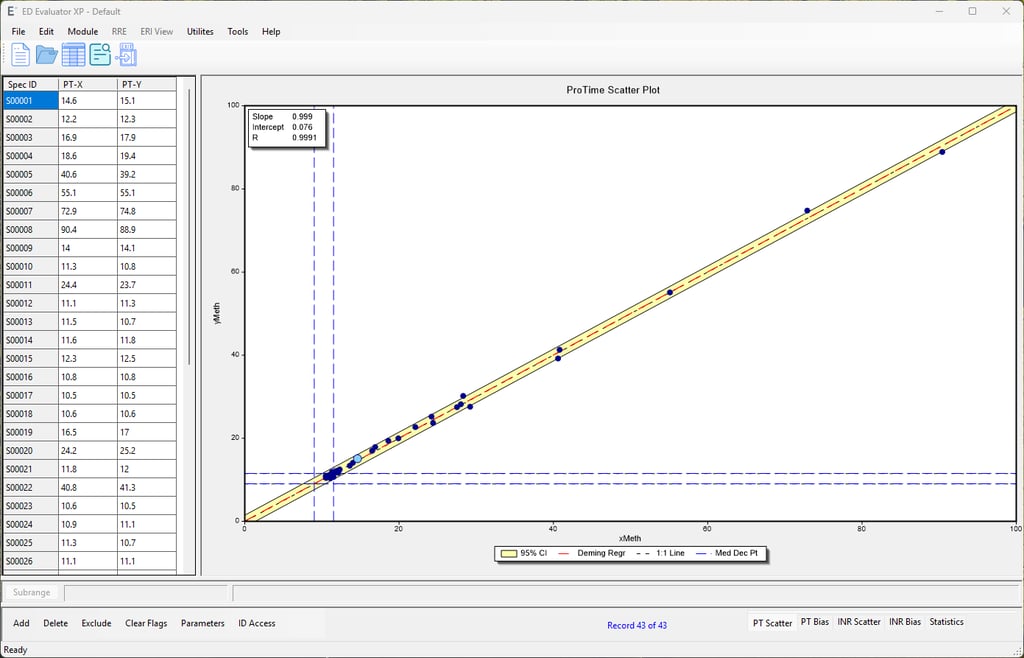
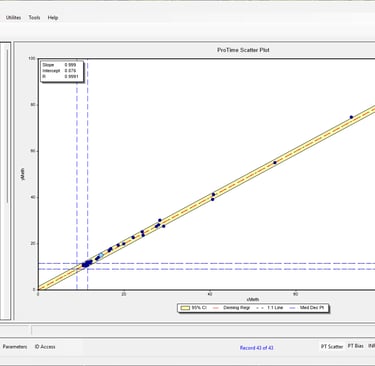
PT/INR Method Comparison (CLSI H54 / CAP Guidelines)
Description: A highly specialized method comparison tailored specifically for coagulation testing. Instead of a standard linear regression, this module evaluates patient Prothrombin Time (PT) and International Normalized Ratio (INR) results across two different lots of thromboplastin reagent or two different coagulation analyzers. It specifically accounts for the International Sensitivity Index (ISI) of the reagents to ensure the mathematical conversion to INR remains clinically accurate.
Use: This is a mandatory regulatory requirement (such as by the College of American Pathologists) whenever your laboratory transitions to a new lot number of PT reagent. Because every batch of biological PT reagent has a slightly different sensitivity (ISI), this experiment proves that patients on vitamin K antagonists (like Warfarin/Coumadin) will receive consistent, life-saving INR results on the new lot, preventing dangerous dosing errors that could lead to bleeding or thrombosis.
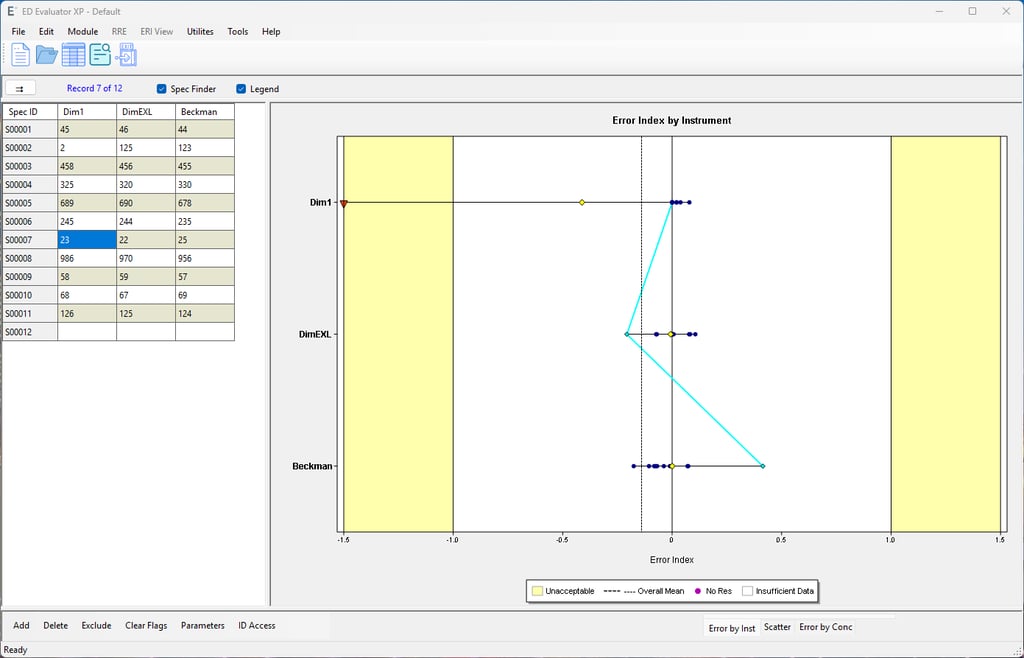
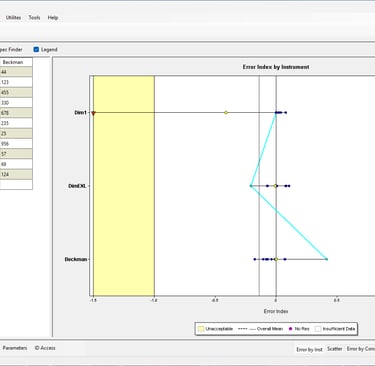
Multiple Instrument Comparison (Comparability / CLSI EP31)
Description: Evaluates the agreement of patient results across three or more instruments simultaneously against a set target to ensure no individual machine exceeds Total Allowable Error (TEa).
Use: Fulfilling regulatory requirements (like CAP/ISO) to prove "fleet harmonization"—ensuring a patient receives the exact same clinical result regardless of which specific analyzer or hospital site processes their sample.
Alternate (Quantitative) Method Comparison (AMC)
Description: Uses linear regression (typically Deming) to prove a new method is statistically identical to an existing one. It passes if, within 95% confidence, the slope is 1.0, the intercept is 0.0, and the predicted Medical Decision Points (MDPs) match.
Use: Validating a newly installed quantitative assay to ensure critical clinical cutoffs (like troponin or glucose diagnostic limits) remain exactly the same for physicians, preventing confusion when interpreting patient results.
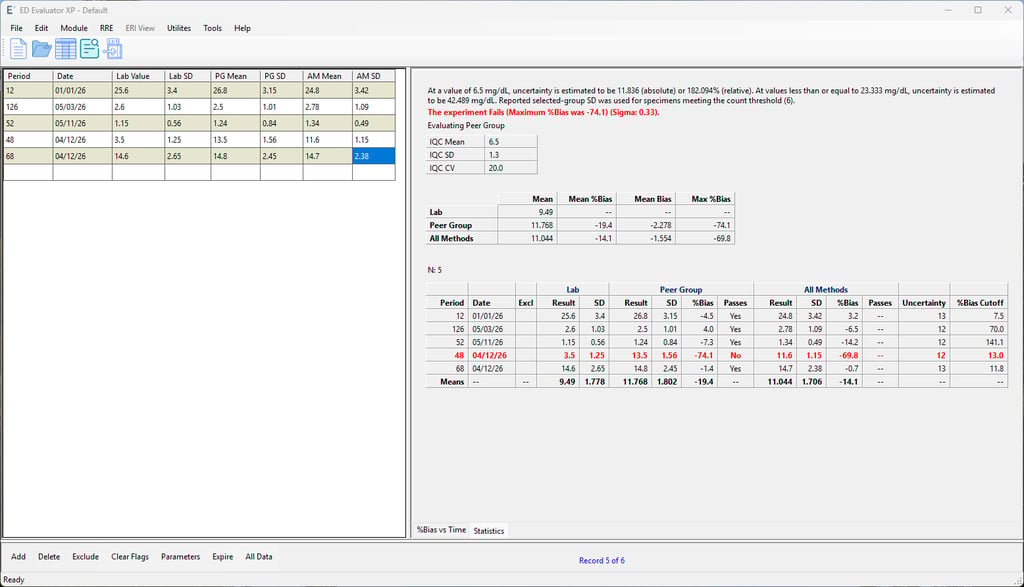
Trueness
Description: Compares daily internal QC data against external peer group summary means (EQC/EQA) to assess systematic bias, calculation of measurement uncertainty, and overall performance against an analytical goal.
Use: Meeting strict international accreditation standards (like ISO 15189 or COFRAC) that require formal, chronological tracking of method accuracy and uncertainty trends.
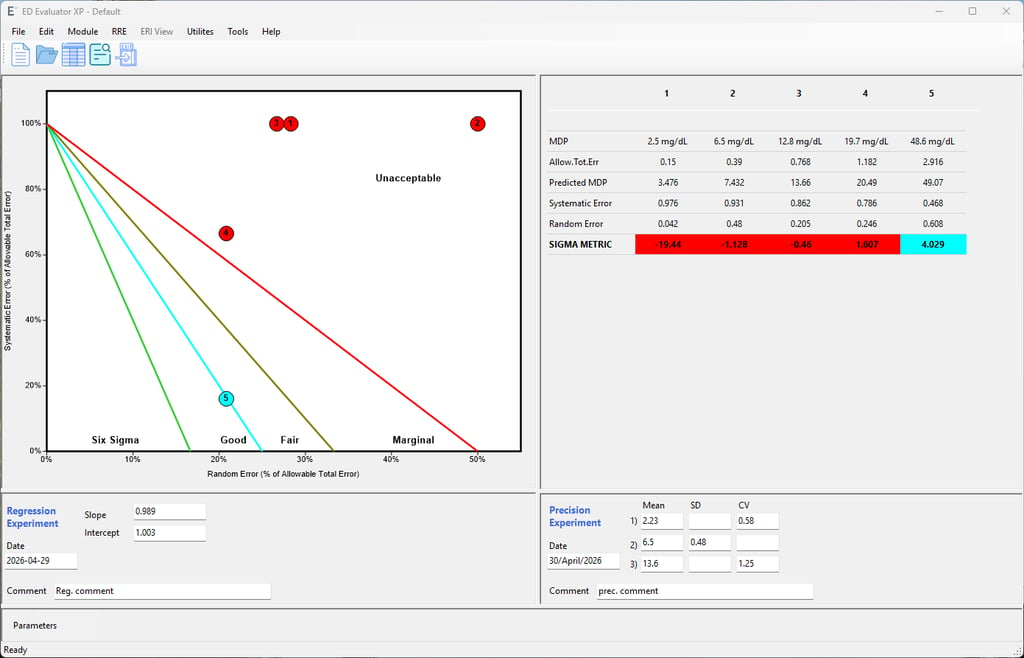
Six Sigma Metrics
Description: Combines observed random error (imprecision from QC) and systematic error (bias from method comparison or linearity) into a single metric calculated as: Sigma = ( TEa − Systematic Error) / Random Error.
Use: Objectively measuring the quality of an assay; a score of 6.0+ indicates world-class performance with minimal error risk, while a score under 2.0 indicates an unacceptable process requiring immediate intervention.
Share project file with Cloude
Very fast and secure way to share projects files between the users by using temporary pass-key

Innovative Solutions for Laboratories
We empower clinical laboratories with cutting-edge software that transforms raw data into insights, ensuring precision and compliance with CLSI standards.


About Our Software
Our sleek interface generates polished reports effortlessly, enhancing decision-making and improving laboratory efficiency for better outcomes.
Transforming Laboratory Data
Cutting-edge software for clinical labs, ensuring precision, compliance, and enhanced decision-making.
Precision Reporting Tools


Generate polished reports effortlessly, enhancing laboratory efficiency and decision-making processes.


Seamless Data Integration
Apply CLSI standards to user data, ensuring accuracy and compliance in laboratory operations.
Enhancing Laboratory Efficiency
Streamline workflows and improve insights with our innovative software solutions.
Get In Touch


Reach out for inquiries about our software transforming laboratory data into actionable insights and reports.
Insights
Transforming data into actionable laboratory insights.
Contact us:
news letters:
support@smartylab.io
© 2026 - 2025 AST LLC. All rights reserved.